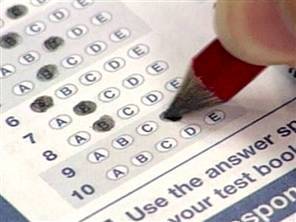
The latest SAT Reasoning Test scores are out and appear to be unchanged from 2009, frustrating college admission officers and education policymakers. Critical reading average scores held steady this year at 501, and mathematics increased by just one point, from 515 to 516. Writing decreased by one point, from 493 to 492.
Overall the 2010 SAT scores show what one education policy analyst called an achievement “flat-line.”
Meanwhile, the National Assessment of Educational Progress (NAEP) and state-level tests show achievement is growing for students in grades 4 and 8, according to a report published by the Center on Education Policy (CEP), suggesting the high schools are doing an even poorer job than the SAT scores indicate.
‘Disappointing’ Results
“It’s more than a little disappointing—and a bit confusing—that the achievement of our nation’s 12th graders continues to flat-line while achievement has gone up significantly in the lower grades, especially in math,” said Michael Petrilli, vice president for National Programs and Policy at the Thomas B. Fordham Institute.
“The hope of reformers for at least two decades has been, as we improve our elementary and middle schools, achievement in high school would rise too,” Petrilli said. “Now it appears that something is happening in the last years of our public education system that is stalling the progress we’ve witnessed for our younger children.”
Petrilli says the explanation for the stagnating scores he finds most compelling is from E. D. Hirsch, an education professor and proponent of a “core knowledge” curriculum. “Our failure to ensure that all kids get a rigorous core curriculum that builds content knowledge in history, science, literature, art, and music means that when students reach the end of high school, they don’t have the vocabulary and background to make sense of complicated texts. And that continues to show up on the SAT,” Petrilli said.
More Students Take SAT
“One possible explanation for apparent SAT stagnation is that larger numbers of high school students are taking the SAT than in previous years, when a greater percentage of SAT takers were applying to Ivy League and other elite schools,” explains Herbert Walberg, a distinguished visiting scholar at the Hoover Institution at Stanford University and a member of the Koret Taskforce on K-12 education.
?Walberg, who also serves as chairman of The Heartland Institute’s board of directors, suggests the improvements in NAEP and state-level tests may not actually reflect improvements in achievement.
“As school staff becomes increasingly familiar with the test content, they may teach it directly,” he explained. “Since school districts increasingly require passing scores to move on to the next grade and to graduate, students may work harder to pass the tests.”
And some students may work harder to cheat. “Large percentages of students admit cheating on tests, and, under pressure, some educators have also cheated,” Walberg said. “The SAT protects the security and confidentiality of its tests much more effectively than do state test administrators.”
ACT Ignored??The problem is deeper than it may initially appear, says Richard Innes, a policy analyst with the Bluegrass Institute for Policy Solutions, a research organization based in Kentucky.
“SAT scores only reflect students who are planning to go to schools on the coasts; in the middle of the country schools rely on the ACT instead,” Innes said.
Innes points to another vexing problem of assessing SAT and NAEP results: How to account for high school dropouts.
“The SAT scores don’t reflect students who have dropped out. In 2007-2008 the average freshman graduation rate for all states reporting was 74.9 percent. That means one out of four kids were not even in school at the time the SAT was offered.”
Without dropouts in the mix, achievement levels behind the standardized test scores may be lower than they appear, Innes explained. “NAEP scores at grade 12 also fall into [the difficulty] of not counting dropouts. They also don’t take into account that students often think of the NAEP as a waste of time—they don’t get individualized test scores, whereas the SAT can affect their future college options.”
‘Something Scary’
The Center on Education Policy report looks at the 4th and 8th grades, which Innes says is more instructive for policymakers. “It’s garbage to compare SAT and NAEP in high school,” he said.
“You’d think SAT scores would show more progress considering that it is a selective sample of students that are still in high school and usually planning on going to college, whereas at grade 8 potential dropouts might still have taken the test,” Innes said.
That appears to make the gap even more significant.
“Something scary is going on: Students are doing worse the longer they are in school,” he said.
“And overall the system is only concentrating on pushing them out the door. This results in a drain on society as well as the country overall losing an advantage in production. That’s why we see so much outsourcing to other countries.”
Innes would like to see a better testing system.
“Looking at national scores hides a lot of trends,” he said. “For example, in Kentucky NAEP scores were up overall, but if you disaggregate white students, the results aren’t so good.”
Sarah McIntosh ([email protected]) is a constitutional scholar writing from Lawrence, Kansas.
Internet Info:
Naomi Chudowsky and Victor Chudowsky, “State Test Score Trends Through 2008-09, Part 1: Rising Scores on State Tests and NAEP,” Center on Education Policy: http://www.cep-dc.org/index.cfm?fuseaction=document_ext.showDocumentByID&nodeID=1&DocumentID=314


