IN THIS ISSUE:
- Data Indicate Climate Change Won’t Slow Crop Yield Increases
- CO2 Emissions from Elites’ Private Jet Use Soar
- UK Government Follows U.S. Lead, Reports Temperatures from Nonexistent Stations
Data Indicate Climate Change Won’t Slow Crop Yield Increases

Our World in Data (OWID) ran a series of articles by Hannah Ritchie exploring the impact of climate change on crop production. On balance, the stories get the facts straight, pointing out yields of key staple crops have increased dramatically, in large part due to the CO2 fertilization effect and modestly warmer temperatures. However, parts of the stories stray into speculation that some crops have increased by less than they would have absent climate change and will decline in the future because of it.
The latter claims are false. They are based on disputed computer model outputs and unjustified beliefs about crop responses to modest temperature increases, not on experience or data, which is what OWID should stick to.
Ritchie’s articles, “Crop yields have increased dramatically in recent decades, but crops like maize would have improved more without climate change,” “How will climate change affect crop yields in the future?,” and “Climate change will affect food production, but here are the things we can do to adapt,” are by and large well-written, data-driven pieces describing the current beneficial impact of climate change on crop production and the tremendous potential of wider penetration of modern agricultural technologies into developing countries to increase production further. The only flaws in the articles are where Ritchie cites unverified studies depending on flawed climate model projections to speculate about what might have happened to some crops absent warmer temperatures, and what might happen in the future.
Ritchie’s series starts off on solid ground by noting the tremendous growth in cereal crops and regionally important staple crops. Ritchie writes,
When considering the net impacts of climate on food production, we need to consider three key factors: higher concentrations of CO2, warmer temperatures, and changes in rainfall (which can cause too much, or not enough, water). …
Carbon dioxide helps plants grow in two ways.
First, it increases the rate of photosynthesis. Plants use sunlight to create sugars out of CO2 and water. When there’s more CO2 in the atmosphere, this process can go faster. …
Second, it means plants can use water more efficiently
Ritchie then goes on to detail how higher CO2 concentrations have boosted crop yields. This is a fact that Climate Realism has pointed out across more than 200 articles previously, such as here, here, and here, to point to a few examples. Data from the U.N. Food and Agriculture Organization (FAO) show that wheat, rice, corn, and other top cereal crops have repeatedly set new records for yield and production during the recent period of modest warming.
FAO data cited in Climate Realism show,
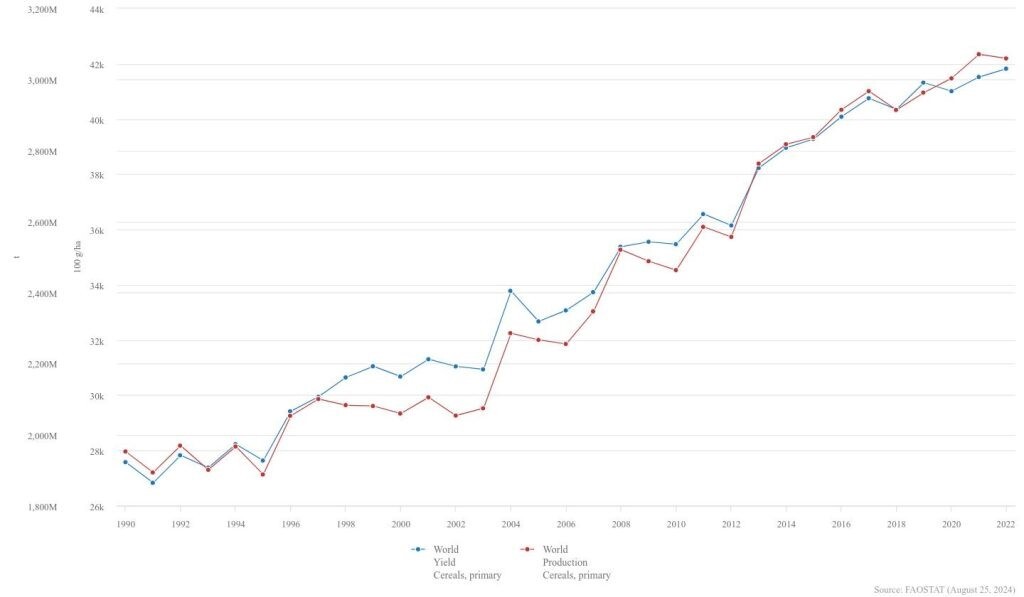
- Cereal yields have increased by nearly 52 percent, with the most recent record for yield set in 2022, and
- Cereal production grew by approximately 57 percent. (See chart below.)

Ritchie expresses concern about three cereal crops: maize, millet, and sorghum, claiming they would have increased more absent climate change, but that is based on a counterfactual analysis based on computer model projections, not data. Ritchie cites studies that suggest many of the areas these crops are grown in have surpassed or are soon to surpass their optimal growing temperatures and every increase above the maximum optimum range will result in declining yields. Yet in the face of a 1.3℃ to 1.5℃ rise over the past century, all three of those crops have experienced substantial yield increases across recent decades, both globally and in the developing countries in the tropical Asian and African countries she worries might not be fully benefitting from CO2 fertilization.
FAO data show global maize yields increased by approximately 55 percent and about 49 percent in Africa between 1991 and 2022.
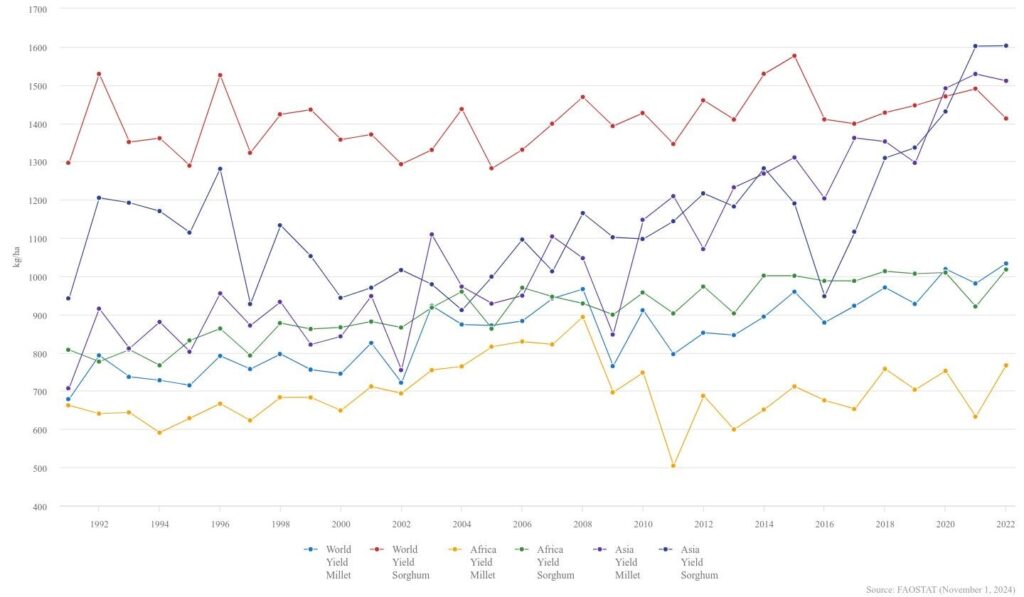
The data from the FAO for millet and sorghum are similar, with each crop showing substantial yield gains globally and across Africa and Asia over the past three decades of modest warming (see graph below).

As we have discussed in more than 200 articles at Climate Realism, what is true of global cereal production is true for most crops, such as fruits, legumes, tubers, and vegetables, in most countries around the world. Yields have set records repeatedly during the recent period of climate change, food security has increased, and hunger and malnutrition have fallen.
Ritchie cites a few studies that suggest the yields of maize, millet, and sorghum would have been even higher absent warming, which resulted in much of their growing regions experiencing temperatures outside of their optimal range—a problem which will only grow in the future if CO2 emissions aren’t restrained—but those claims suffer from several flaws.
First, most of the regions of concern for the growth of maize, millet, and sorghum sit astride or are near the equator. The climate change theory says equatorial regions are least likely to experience much temperature rise; temperatures are expected to increase dramatically nearest the poles. Little or no temperature rise for the regions of concern means exceeding what some scientists speculate are optimum temperatures should not be a problem.
Second, Ritchie is right that changes in precipitation can reduce crop production. Once again, however, that should not be a concern. Many of the areas Ritchie highlights in Africa and Asia experience periodic or even seasonal drought. As Ritchie notes, however, CO2 fertilization results in crops using water more efficiently, losing less water due to transpiration, so crops should benefit. In addition, many countries in Africa and Asia depend on rainfall for crop production, with limited access to modern irrigation infrastructure. Here, climate change helps: most research suggests, and the IPCC projects, that climate change will result in increased precipitation, which means more water for crops. This means that where the water is seasonal, as it is in many countries, more can be stored for later use when rain or snowfall is lacking.
Third, the claim that climate change harms crops is contradictory in theory. Climate alarmists claim higher CO2 is driving rising temperatures, but if so, the higher temperatures are a key effect of CO2, meaning without the CO2, temperatures might not rise. Yet, CO2 is the key factor driving growing crop yields, so without the CO2 increases, crop yields would not have increased or crops would continue to grow more slowly than before, if at all.
On this theory, if you want the CO2 fertilization, you have to accept the modest temperature increase. Cutting CO2 concentrations to avoid a minimal temperature rise would kill the golden goose for crop yields, resulting in a larger decline in or slower growth of yields than any modest decrease in yields that might result from the associated small temperature rise the models project.
What are we left with is this: crop yields have increased thanks to rising CO2 concentrations, reducing hunger in the process, and there is no reason to believe CO2 fertilization won’t continue to produce yield increases for the foreseeable future—unless climate policies force lower CO2 concentrations.
What’s true for the crops Ritchie discusses is true for most other crops as well, be they cereals, fruits, vegetables, or tubers. Other crops have benefited from longer growing seasons, fewer late-season frost events, and the carbon dioxide fertilization effect. Data presented in The Heartland Institute report “The Social Benefits of Fossil Fuels” demonstrate the “increase in atmospheric [carbon dioxide] concentration … caused by the historical burning of fossil fuels has likely increased agricultural production per unit [of] land area by 70 percent for C3 cereals [which include rice, wheat, and oats, as well as cotton and evergreen trees], 28 percent for C4 cereals [which include sorghum, maize, and various grasses], 33 percent for fruits and melons, 62 percent for legumes, 67 percent for root and tuber crops, and 51 percent for vegetables.”
The increases in food production and yields have been widespread, with crop production increasing in developed countries and developing countries alike, and in temperate and warmer regions alike.
Climate Realism posts show agricultural productivity has increased dramatically in Africa, here, here, and here; in the Middle East, here and here; in Latin America, here, here, and here; in Asia, here, here, and here; and in North America, here, here, here, here, and here, along with other citations.
This increase in food production has occurred even as the number of people and the amount of land devoted to growing crops has declined. Fewer people, farming less land, producing higher yields reflects increasing productivity, not a decline.
Thousands of field experiments discussed at CO2 Science also confirm the boom in production across crop categories caused by a modest warming, more CO2, and better water conditions.
As importantly, as Ritchie points out, any foreseeable negative effects that climate change might have on crops, especially in developing countries, would be far outweighed by those countries gaining broader access to modern agricultural technologies such as fertilizers, pesticides, modern farm equipment, and infrastructure. Ritchie writes,
[T]here are other things we can do to mitigate this risk and counteract some of these pressures.
There are still huge yield gaps across the world today. “Yield gaps” are the difference between the yields that farmers currently get and could get if they had access to the best seeds, fertilizers, pesticides, irrigation, and practices that already exist today.
Let’s take the example of Kenya and maize. Farmers currently grow around 1.4 tonnes per hectare. However, researchers estimate that farmers could get 4.2 tonnes if they had access to the best technologies and practices available today. That means the yield gap is 2.8 tonnes. …
In some of the worst climate scenarios, Kenya could see a 20% to 25% decline in maize yields. If nothing else changed, that would cut its current yield of 1.4 tonnes to around 1.1 tonnes: a drop of 0.3 tonnes.
However, the current yield gap of 2.8 tonnes is much larger than the 0.3 tonnes drop that might be expected with climate change.
The elements of modern agriculture—such as the chemicals used to enhance crop growth, those used to protect crops from pests, and the machinery used to plant, water, harvest, store, and transport crops—use or are created using fossil fuels. The tremendous benefits of these technologies to producers and consumers alike far outweigh any possible negative impact on agriculture from climate change possibly caused by the use of fossil fuels.
You can’t have high crop yields without CO2 and modern, fossil-fuel-intensive agricultural infrastructure. That’s the lesson readers should take away from Ritchie’s “Our World In Data” article series.
Sources: Climate Realism; Our World in Data; UN Food and Agriculture Organization
CO2 Emissions from Elites’ Private Jet Use Soar

Research recently published in the journal Nature by an international team of scientists from universities in Sweden, Germany, and Denmark finds the rich really are different from the rest of us, perhaps nowhere more than in their use of private jets basically as taxis, massively boosting their personal carbon dioxide emissions.
The researchers used flight tracking data for private aircraft between 2019 through 2023:
Flight times for 25,993 private aircraft and 18,655,789 individual flights in 2019-2023 are linked to 72 aircraft models and their average fuel consumption. We find that private aviation contributed at least 15.6 Mt CO2 in direct emissions in 2023, or about 3.6 t CO2 per flight. Almost half of all flights (47.4%) are shorter than 500 km. Private aviation is concentrated in the USA, where 68.7% of the aircraft are registered. Flight pattern analysis confirms extensive travel for leisure purposes, and for cultural and political events. Emissions increased by 46% between 2019-2023, with industry expectations of continued strong growth.”
The 0.003 per cent of the population that own private jets are responsible for an “outsized” share of human CO2 emissions, and those emissions have grown 46 percent in the past five years, after the Paris climate agreement.
“The most frequent fliers each churned out 2,400 tonnes of emissions in 2023—more than 500 times as much as the average individual,” reported the Daily Mail.
Many of these trips could have been taken by car, train, or bus.
“Almost half the private jet flights made in 2023 covered less than 310 miles (500km)—about the distance from Edinburgh to London—while almost 5 per cent travelled less than 31 miles (50km),” wrote the Daily Mail.
The Associated Press, in its report on the study, expanded on the elites’ carbon emissions, noting that earlier in 2024 “the International Energy Agency calculated that the world’s top 1% of super-emitting people had carbon footprints more than 1,000 times bigger than the globe’s poorest 1%.”
The scientists involved in the Nature report found the private jet use for just five events—2022’s World Cup in Qatar, 2023’s World Economic Forum, the 2023 Super Bowl, the 2023 Cannes film festival, and the 2023 United Nations climate negotiations in Dubai—produced 35,600 tons of carbon dioxide emissions, not counting emissions from onsite transportation, food, and housing for the elites attending the events.
“It’s a grim joke that the billionaire class is flying private jets to the annual climate conferences, and the United Nations should crack down on this hypocritical practice,” Jean Su, energy justice director for the Center for Biological Diversity, told the Associated Press.
Source: Associated Press; The Daily Mail; Nature
UK Government Follows U.S. Lead, Reports Temperatures from Nonexistent Stations

It turns out the United Kingdom’s official meteorological service, the Met Office, is following the U.S. government’s ignoble and scientifically illegitimate practice of making up temperature “data” for nonexistent stations. The Met Office, you may recall, was one of the parties implicated in the Climategate scandal.
As I reported in April in Climate Change Weekly 503, an investigative report conducted by the Epoch Times found “NOAA fabricates temperature data for more than 30 percent of the 1,218 USHCN reporting stations that no longer exist.”
Ray Sanders, whom The European Conservative describes as a citizen journalist, recently sent a Freedom of Information request to the Met Office for the location of its stations. He visited them and found 103 of the 302 weather stations supposedly providing daily temperatures don’t exist. The Met Office is making up data for those locations.
The Met Office refused to provide an explanation of how nonexistent stations were reporting data and, because those stations don’t exist, how the Met office generated the “temperature readings” reported for those locations.
“For instance, in his English home county of Kent, Sanders observed that half of the eight official Met Office sites are in his words, ‘fiction,’” The European Conservative reported. “Sanders discovered that data is still reported for the Dungeness station which closed in 1986 … [along with] stations alleged to be at Folkestone, Dover, and Gillingham. …”
Sanders documented his discovery in a letter to the new Science Minister, Labour MP Peter Kyle, with a message asking, “How would any reasonable observer know that the data was not real and simply ‘made up’ by a government agency?” In the document Sanders sent to Kyle, he called for “an ‘open declaration’ of likely inaccuracy of existing published data, ‘to avoid other institutions and researchers using unreliable data and reaching erroneous conclusions,” according to The Daily Sceptic, which noted,
The practice of ‘inventing’ temperature data from non-existent stations is a controversial issue in the United States where the local weather service NOAA has been charged with fabricating data for more than 30% of its reporting sites. Data are retrieved from surrounding stations and the resulting averages are given an ‘E’ for estimate. “The addition of the ghost station data means NOAA’s monthly and yearly reports are not representative of reality,” says meteorologist Anthony Watts. “If this kind of process were used in a court of law, then the evidence would be thrown out as being polluted,” he added.
Sanders found a second flaw in the Met Office’s temperature data, citing the classification from the World Meteorological Organization, The Daily Sceptic reports:
Almost eight in 10 sites are rated in junk classes 4 and 5 with possible “uncertainties” of 2°C and 5°C respectively. This means, notes Sanders, that they are not suitable for climate data reporting purposes according to international standards which the Met Office was party to establishing. Only 52 Met Office stations, or a paltry 13.7%, are in Class 1 and 2 with no suggested margin of error. Actually, mark that down by at least one. In his travels, Sanders pointed out the possible heat corruptions at Class 1 Hastings and this site has now been dropped to Class 4.
One more source of surface station data that can’t be trusted. False or extrapolated temperature data makes a poor foundation for arguments for a forced march to net-zero.
Source: The European Conservative; The Daily Sceptic


