IN THIS ISSUE:
I am travelling, but a didn’t want regular Climate Change Weekly’s readers to go multiple weeks without important climate material to read so this issue is a little bit different. Some readers may only read the lead essay each week, in a newspaper that would be above the fold, while only briefly glancing at the shorter summaries of science stories lower in each week’s report. In this issue, I’ve gone back over the past 9 months and chosen a few CCW science summaries that readers may have missed or forgotten, but that I think merit special attention and are worth reminding readers of. I hope you agree! BTW, to keep this issue at least somewhat manageable in length while packing more stories in, I’ve removed some of my commentary on the importance of each article, letting each summary stand on its own.
Disaster Deaths at an All Time Low
Expanding Forests Are Removing More CO2
Days of Extreme Cold and Heat Are Declining
Sinking Land Is Driving Recent Sea Level Rise Measurements
Earth’s CO2 induced Greening Is Larger than Previously Calculated
Disaster Deaths at an All Time Low (CCW 568: January 16, 2026)
There has been a dearth of mainstream media coverage of perhaps the most important climate-related story of the past year: it is likely that fewer people died as a result of extreme weather events and temperatures in 2025 than at any time in history for which there is hard data. I haven’t seen or heard a single mainstream media outlet reporting on this fact and celebrating the good news, but it’s true.
As Roger Pielke Jr., Ph.D. writes at his insightful Substack, “The Honest Broker”:
According to data from the Centre for Research on the Epidemiology of Disasters (CRED) at the Université Catholique de Louvain, Belgium (via Our World in Data), through October 2025, the world saw about 4,500 deaths related to extreme weather events. Tragically, the final two months of 2025 saw large loss of life related to flooding in South and Southeast Asia, associated with Cyclones Senyar and Ditwah.
While the final death tolls are not yet available, reports suggest perhaps 1,600 people tragically lost their lives in these and several other events in the final two months of the year.
If those estimates prove accurate, that would make 2025 among the lowest in total deaths from extreme weather events. Ever! I am cautious here because the recent decade or so has seen many years with similarly low totals—notably 2014, 2015, 2016, 2018, 2021.
A single year’s reduction of deaths may be down to luck, like having a year of relatively few extreme-weather events, but that isn’t the case for 2025: hurricanes were about normal, as were flooding, wildfires, and drought. Some places had worse weather than others, as in every other year, but the data overall show no substantial increases or declines relative to the average. What’s more telling than a single year’s low death toll from climate-related events is the long-term trend for such events. Pielke notes that according to the available data,
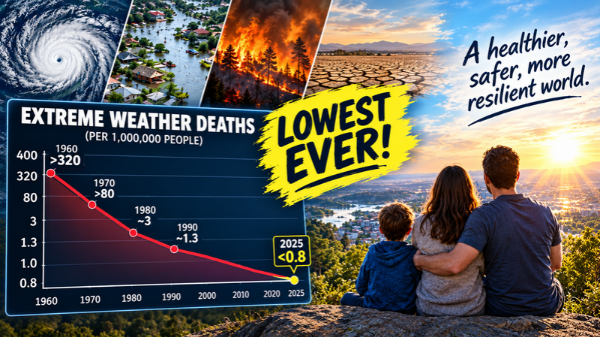
What we can say with some greater confidence is that the death rate from extreme weather events is the lowest ever at less than 0.8 deaths per 1,000,000 people (with population data from the United Nations). Only 2018 and 2015 are close.
To put the death rate into perspective, consider that:
- in 1960 it was >320 per 1,000,000;
- in 1970, >80;
- in 1980, ~3;
- in 1990, ~1.3;
Since 2000, six years have occurred with <1.0 deaths per 1,000,000 people, all since 2014. From 1970 to 2025 the death rate dropped by two orders of magnitude. This is an incredible story of human ingenuity and progress.
Commenting on this trend, Marc Morano, who operates the Climate Depot website, told Houston’s KTRH 740 AM News, “What is amazing about this, it continues a trend. … If you go back to the 1920s, there has been a 97 percent drop in extreme weather deaths.”
Sources: KTRH; Just the News; The Honest Broker;

Expanding Forests Are Removing More CO2 (CCW 571: February 20, 2026)
Research published in the journal Biogeosciences shows boreal forests have expanded northward during the recent period of climate change, leading to a substantial uptake in carbon dioxide: as the forests have grown, so has their role as a carbon sink.
An international team of 14 researchers representing universities and research institutes spanning five countries examined a variety of local, national, and international data sets and studies of tree cover distribution, as well as Landsat satellite data at scales of 250 down to 30 meters, to establish a comprehensive picture of boreal forest changes (in this case expansion over decades).
The boreal forest has experienced the fastest warming of any forested biome in recent decades. As they write in the abstract of their study, the researchers found,
From 1985 to 2020, boreal tree cover expanded by 0.844 million km2, a 12 % relative increase since 1985, and shifted northward by 0.29° mean and 0.43° median latitude. Gains were concentrated between 64–68° N and exceeded losses at southern margins, despite stable disturbance rates across most latitudes. Forest age distributions reveal that young stands (up to 36 years) now comprise 15.4 % of forest area and hold 1.1–5.9 Pg of aboveground biomass carbon, with the potential to sequester an additional 2.3–3.8 Pg C [carbon] if allowed to mature. These findings confirm the northward advance of the boreal forest and implicate the future importance of the region’s greening to the global carbon budget.
The Earth’s carbon budget is the made-up or assumed maximum amount of cumulative, net global anthropogenic CO2 emissions that can be released into the atmosphere while limiting global warming to a specific level. If the Earth is absorbing more CO2 than was anticipated or assumed, the amount of CO2 that can be released into the atmosphere without hitting a specified amount of warming (assuming CO2 drives warming) is larger than what is budgeted in climate models.
The expansion and change in age structure of the boreal forest is critical to understanding the carbon budget because “the boreal biome is Earth’s most expansive and ecologically intact forest,” as the study states. “The region contains . . . a total biomass rivaling the tropics and half of global soil C.”
“Its forested area comprises a third of the global total and accounts for 20.8 % of the total forest carbon (C) sink,” the study states. Boreal tree cover also controls the reflective and thermal balance of solar radiation in the high northern latitudes, posing a positive feedback mechanism for greenhouse atmospheric warming.
In short, a larger boreal forest, with a shift toward younger trees with long growth spans, means either more CO2 is being taken out of the atmosphere or will be taken out of the atmosphere than is accounted for by most climate models and theories, and/or more carbon dioxide can be emitted into the atmosphere before reaching temperatures that policymakers want to avoid.
In either case, this research indicates the science isn’t settled on the carbon budget.
Sources: Phys.org; Biogeosciences
Days of Extreme Cold and Heat Are Declining (CCW 578: May 1, 2026)
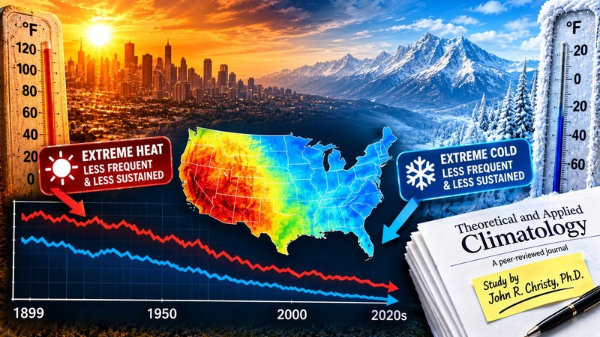
A new study from John R. Christy, Ph.D., former Alabama State Climatologist, director of the Earth System Science Center, and distinguished professor of atmosphere and earth science at the University of Alabama at Huntsville, undertook a long-term accounting of temperature trends. The study, published in the peer-reviewed journal Theoretical and Applied Climatology, reports extreme temperatures, both extreme heat and extreme cold, have become less frequent and sustained across the continental United States since 1899.
Christy analyzed more than 40 million daily temperature readings from 1,211 weather stations. Where a weather station during that time discontinued operation or had incomplete records, Christy filled in data from nearby stations after filtering out possible sources of bias. Per the abstract,
Extreme temperature metrics for summer daily maximum temperatures and winter daily minimum temperatures were calculated. The general result is that metrics for extreme summer heat, e.g., hottest values, number of heatwave days, etc., show modest negative trends since 1899. Extreme cold temperature metrics also indicate a decline in their occurrences especially since the 1990s. In sum, instances of both hot and cold extreme metrics have declined since 1899.
“Knowledge of temperature extremes, and their potential changes within a climate system of increasing greenhouse gases, is of vital interest for humans and the infrastructure which supports them,” Christy writes in the study’s abstract, explaining the need for and importance of the study in the context of the scientific and public policy debate over climate change. “This dataset allows us to ask—and answer—questions about extreme heat and cold with more confidence, given the amount of data available now,” Christy writes in an article about the study.
“Understanding how extremes have changed over time is essential for interpreting (dispassionately) how today’s events actually compare with the past,” wrote Christy.
The data show the most intense heat events occurred between 1925 and 1954, particularly during the 1930s, the study states. Christy’s analysis found no long-term increase in extreme summer heat nationwide.
By contrast, periods of extreme cold have noticeably declined, especially since the 1990s, with fewer record-low temperatures and less-severe winter extremes. This is due to a modest warming at night during the winter, found in higher winter nighttime lows attributable in part to the urban heat island effect where development has taken place around urban, suburban, and even some poorly sited rural weather stations.
Because extremes of summer heat haven’t changed much and periods of extreme cold have declined, the study also found the difference between the hottest and coldest annual temperatures has narrowed by about six degrees over the full record, “suggesting less overall variability in temperature extremes,” as noted by Fox 54 Alabama’s report on the findings.
To demonstrate an application of this dataset, Christy compared the results produced by his analysis of the long-term data to claims made by U.S. Global Change Research Program’s National Climate Assessment (NCA) that heatwaves have increased since the 1960s. These claims are not borne out by the comprehensive temperature data Christy analyzed. Instead, there has been a small, statistically insignificant change, primarily in parts of the Western United States where population growth has been rampant. When the temperature data is extended back to 1899, it shows heat extremes have actually declined nationwide, and the trend identified by the NCA disappears. There is no correlation to greenhouse gas emissions.
Sources: Fox 54; Theoretical and Applied Climatology; University of Alabama at Huntsville
Sinking Land Is Driving Recent Sea Level Rise Measurements (CCW 580: May 22, 2026)
Sea levels are rising, as they have with some regularity since the end of the last glacial cycle. They have in fact risen more than 400 feet on average around the globe over the past 12,000 years.
Although there is no consistent trend for sea levels—with measured rise at tide gauges remaining relatively flat in some locations, rising in others, and even declining in some locations—in general the data show seas are rising at about .08 to 1.2 inches a decade, depending on whether satellite measurements (and which sets of satellite data) or tide gauge data is used. Recently a new array of satellites has measured a slight uptick in global average sea level rise. Leaving aside the question of whether the slight increase, if true and not an artifact of change in the satellite measurement system, is outside the norm of historic sea level rise (it’s not), or unmanageable (it’s not), the question remains: What accounts for the recent rise in sea levels?
A paper in Nature finds it’s a combination of human and natural factors, and that one of the anthropogenic causes is underappreciated and may be a larger factor than global warming.
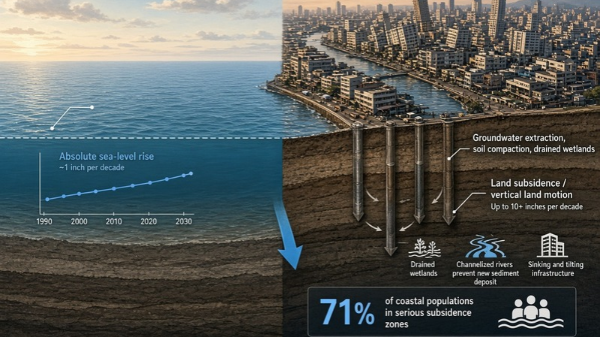
An international team of 11 researchers from universities and research institutes in the United States, the United Kingdom, Germany, Canada, and China note the role and causes of land subsidence or vertical land motion (VLM), often confused with rising seas, are little-studied but are a large factor in the measured increase in average sea levels.
The team examined data from 65 percent of coastal cities, including delta cities across South East Asia, which are not commonly covered in research on coastal sea level rise. They found that from 1995 to 2020, coastal populations experienced twice as much sea level rise as could be attributed to factors such as global warming. In fact, their data suggests 71 percent of coastal populations are living in zones with serious subsidence problems.
Dozens of articles at ClimateRealism.com have pointed out the role land subsidence plays in measured sea level rise, complicating the ability to distinguish the contribution of natural factors, including from climate change, versus other human factors.
Heavy development on soft coastal soils leads to compaction; rivers being channelized for ship traffic and to reduce random flooding prevents historical soil deposition; wetlands being drained for development results in greater flooding and rising tides; and groundwater withdrawal for growing coastal populations’ water needs causes direct subsidence. These are all serious human factors resulting in significant VLM.
“Observations show that VLM can exceed contemporary absolute sea-level . . . changes by as much as an order of magnitude (or more) in susceptible areas, like global deltas and especially coastal cities located on deltas,” write the research team. “[G]roundwater-extraction-related subsidence rates of up to 10 mm/year have contributed to much higher [relative sea level rise] changes than the global average in deltas, such as in the Mekong delta … , or cities built on low-lying deltaic and coastal plains such as Bangkok, Manila, or Jakarta.”
Although the researchers involved in this study do not suggest they doubt climate change is contributing to sea level rise, their research indicates that as coastal areas are increasingly developed, VSL is playing a larger role than climate change in relative sea level changes than is commonly acknowledged, and maybe even a bigger role than climate change in many locations.
Sources: Nature; Climate Realism
Earth’s CO2 induced Greening Is Larger than Previously Calculated (CCW 588: August 21, 2026)
To relatively little fanfare and almost no mainstream media coverage, a recent study published in the journal Nature finds the Earth continued greening through 2025, setting new records for global leaf and vegetation cover—a record largely attributable to the fertilization effect of rising carbon dioxide (CO2) concentrations.
The international team of scientists and scholars from universities and research institutes in China, the United Kingdom, and the United States integrated multidecadal remote sensing, optical Earth observation indices, and long-term land-cover annual data sets to discover anomalies and trends over time. What they found is good climate news—for those who care about the Earth’s vegetation.
The study found “2025 set a record for global vegetation greenness, steepening the global average greening trend [measured] from” 2000 through 2024.
The beneficial greening was not limited to select regions or continents. It was experienced around the globe, in large parts of Africa, Australia, China, Europe, North America, and South America. In addition, the greening was common across plant types. The study found:
- nearly 80 percent of croplands experienced greening;
- a little over 72 percent of grasslands greened appreciably; and
- 60 percent of forests exhibited increased greening.
Commenting on the mainstream media’s stubborn insistence, hard data be damned, that climate change is causing a browning of the Earth and crop failures, Chris Morrison writes in the Daily Sceptic,
This greening story—a tale that gets more impressive every year—is largely absent from the mainstream media. It was certainly missing from a recent climate contribution from Sandwich-board Stanley (a.k.a. Tim Stanley of the Telegraph) who made an unsourced claim that one third of the agricultural production of Bangladesh “is feared to vanish by 2050”. Happily, there is no sign of that invented fear coming true since agricultural production has more than doubled in the country since the turn of the century. Notes Stanley: “The evidence is stacking up—we only have to look out of our windows,” a comment that suggests journalists hired to broadcast opinions and beliefs should steer well clear of science where data and facts are given a higher priority. …
Canadian psychologist, author, and popular public speaker Jordan Peterson responded to Stanley’s Telegraph article with his own in the paper a few days later, writing,
Widespread catastrophic desertification and system wide crop failure have largely failed to materialize. Instead, the broader trend has been of increasing agricultural yields and vegetation density. What actually happened did not follow the predictions and should force a drastic re-evaluation of the entire climate narrative, not least among those committed to honesty and scientific integrity.
It’s good that prominent writers are publicizing the reality of global greening. It’s the same message Climate Realism, Climate Change Weekly, and Climate at a Glance have discussed across dozens of articles and posts over the years.
Source: Nature (behind paywall); The Word Merchant; The Daily Sceptic
Recommended Sites

H. Sterling Burnett, Ph.D., is the Director of the Arthur B. Robinson Center on Climate and Environmental Policy and the managing editor of Environment & Climate News.