Executive Finding (Summary):
A two-year, side-by-side measurement comparison at Reno-Tahoe International Airport demonstrates that due to station siting and localized Urban Heat Island (UHI) effects a persistent warm bias of approximately 1–3°F is introduced into official surface temperature records for Reno, particularly in nighttime minimum temperatures. A properly sited, USCRN-modeled reference station (GOATS), located only 1.11 miles from the official airport station but away from heat-retaining surfaces, consistently measured cooler and more representative air temperatures under the same weather conditions.
These findings are consistent with the conclusions of the 2022 Heartland Institute report “Corrupted Climate Stations: The Official U.S. Surface Temperature Record Remains Fatally Flawed”, which documented widespread warm bias from poor station siting nationwide. Together, the Reno measurements and prior national analyses confirm that microsite exposure alone can materially influence reported warming and should be explicitly evaluated in climate data audits and policy-relevant assessments, and acknowledged and accounted for in reports on temperatures and reports relying on recorded temperature data that claim the data shows human fossil fuel use is causing dangerous warming.
What is GOATS, the Urban Heat Island (UHI), and Why They Matter
The Global Open Atmospheric Temperature System (GOATS) is an independent air-temperature measurement system designed to answer a simple but critical question:
Are reported surface air temperatures being influenced by local heat sources around weather stations rather than by changes in the atmosphere itself?
Central to this question is the Urban Heat Island (UHI) effect. UHI refers to the well-documented tendency for built up environments—such as asphalt, concrete, buildings, and machinery—to absorb heat during the day and release it slowly at night. This process raises nearby air temperatures, particularly overnight minimum temperatures, even when the broader regional weather has not changed. UHI matters because it can introduce artificial warming into temperature records that are later interpreted as climate change.
GOATS was deliberately modeled after the National Oceanic and Atmospheric Administrations (NOAA)United States Climate Reference Network(USCRN), which represents NOAA’s highest standard for robust, low-bias surface temperature measurement. Like USCRN stations, GOATS employs modern digital sensors, triple redundant temperature measurements, proper solar radiation shielding, and strict siting rules per NOAA’s specification designed to minimize UHI and other microsite heat biases.
GOATS stations record air temperature every minute, providing timely, high-resolution data that accurately capture daily highs and lows while enabling direct, real-time comparison with official stations. All data are published openly and without adjustment. The purpose is not to replace NOAA networks, but to provide parallel reference measurements for comparison to official government stations. The data so far demonstrate a visible, measurable, and quantifiable, UHI-related bias at official sites.
Reno, Nevada was selected as an early deployment site because it offers a rare opportunity: a long-running official airport station with a known UHI signature, and nearby land suitable for a properly sited reference station exposed to the same weather.
Executive Summary of Findings
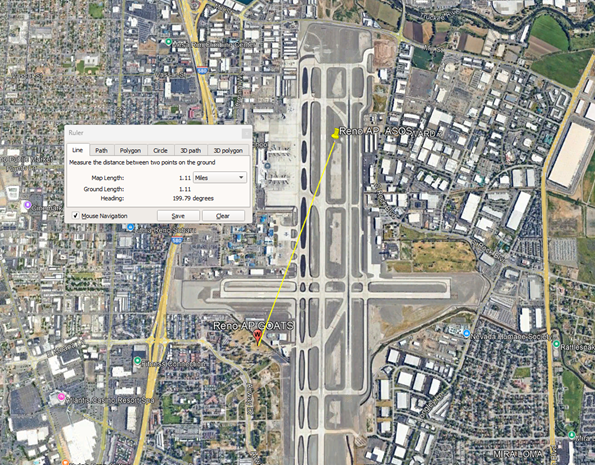
A GOATS station was installed on the grounds of Reno‑Tahoe International Airport in December 2023, approximately 1.11 miles from the official airport temperature station known as ASOS (Automated Surface Observing System). Both stations measured the same local weather over nearly two full years.
The only meaningful difference between the two stations was microsite exposure:
- The official ASOS station sits among runways, pavement, and equipment buildings.
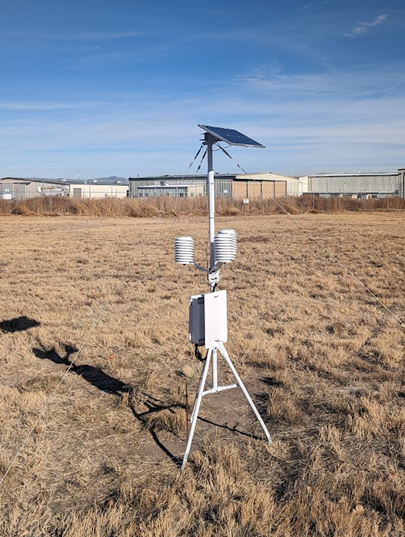
- The GOATS station (seen at left) was placed in a grassy area, more than 100 feet from pavement and buildings, consistent with NOAA siting guidance.
The Reno ASOS airport weather station is sited between runways, as seen below.
The resulting data from show a persistent and systematic warm bias at the official airport station, especially at night.
What Was Measured
Daily temperature values from both stations were compared for 2024 and 2025:
- Tmax – daily high temperature
- Tmin – daily low temperature (overnight)
- Tavg – daily average, calculated as (Tmax + Tmin) ÷ 2
Coverage was nearly complete:
- 2024: 366 days of parallel data
- 2025: 347 days of parallel data (18 missing GOATS days due to equipment failure)
This provides a statistically robust, real‑world comparison using direct measurements rather than models or adjustments.
Key Results
Across both years, the official Reno ASOS station reported higher temperatures than the GOATS station on the vast majority of days.
Average differences (Reno ASOS minus GOATS.) A positive value indicates Reno ASOS to be warmer:
2024
- Daytime highs (Tmax): +1.35°F
- Nighttime lows (Tmin): +2.91°F
- Daily average (Tavg): +2.13°F
2025
- Daytime highs (Tmax): +0.64°F
- Nighttime lows (Tmin): +2.20°F
- Daily average (Tavg): +1.42°F
Data shows the official Reno ASOS airport station was warmer than GOATS on more than 90% of nights in both years.
Why the Nighttime Temperature Data Matters
The strongest separation between the two stations occurs in overnight minimum temperatures, not daytime highs. This pattern is a well-documented indicator of Urban Heat Island (UHI) influence.
The daily average (Tavg) temperature is used by NOAA and other climate agencies to track climate change over decades. Since the nighttime lows (Tmin) at the GOATS station is consistently lower than the Reno ASOS airport station, it becomes clear that warmer overnight minimum temperatures bias suggests that the temperatures is lower than is being recorded with the long-term climate signal higher is accurate for the Reno area.
Hard surfaces such as asphalt, concrete, machinery, and buildings absorb heat during the day and release it slowly at night, suppressing natural cooling and elevating minimum temperatures. This mechanism is summarized in NOAA aligned explanations of UHI behavior and is clearly illustrated in public-facing analyses such as Climate at a Glance: Urban Heat Islands.
The Reno data match this expected UHI behavior precisely, with the largest and most consistent temperature differences occurring at night rather than during daytime heating.
What Reno Demonstrates
The Reno comparison demonstrates that:
- Station placement alone can introduce between 1 and 3°F of warming into daily temperature records.
- The effect is systematic, not random, and persists year-round.
- Nighttime temperatures are most affected, which strongly influences daily and monthly averages.
These results are fully consistent with broader national findings. The 2022 Heartland Institute report “Corrupted Climate Stations: The Official U.S. Surface Temperature Record Remains Fatally Flawed” documented that the majority of U.S. surface temperature stations fail NOAA siting standards and are subject to similar UHI-driven warm biases.
The Reno experiment provides a concrete, real-world case study that mirrors those national conclusions using direct, side-by-side measurements rather than retrospective station surveys.
What our Reno Findings Do Not Claim
The Reno results do not attempt to explain long‑term global climate trends, nor do they claim that all warming is artificial or a result of the UHI bias. Instead, they address a narrower but critical issue:
Before interpreting long‑term climatic temperature trends, the influence of station exposure must be understood and quantified, and incorporated into analyses of and reporting on trends.
If station siting can introduce temperature differences comparable to decades of reported warming, those effects cannot be treated as negligible.
Policy Relevance
Reno has been cited publicly as one of the fastest‑warming cities in the United States by multiple media outlets. The measurements presented here show that a substantial portion of observed local warming is plausibly explained by the location of the official temperature station, particularly its surroundings rather than a broader atmospheric trend alone.
The broader implication is straightforward: surface temperature data used in policy discussions should be evaluated with explicit attention to station siting and microsite bias.
Closing Considerations for Officials and Policymakers
The Reno findings highlight a fundamental but often underexamined issue in surface temperature reporting: measurement integrity precedes interpretation. Before temperature data are aggregated, adjusted, or used to justify regulatory, infrastructure, or energy policy decisions, the physical exposure of the measuring instruments themselves must be understood and documented. Accurate, not inherently biased, data must be used to inform policy, otherwise the scope of an problem is correctly identified and any solutions may be unnecessary, unnecessarily costly and prescriptive, and even, possibly, counterproductive or harmful.
This analysis shows that microsite Urban Heat Island (UHI) effects alone can introduce temperature differences comparable to decades of reported climate warming, without any change in local atmospheric conditions. For auditors, this underscores the importance of verifying station siting, surroundings, and metadata as rigorously as the data values themselves. For policymakers, it means that confidence in conclusions drawn from surface temperature records depends directly on confidence in how—and where—those temperatures were measured, and how any bias is accounted or adjusted for.
Independent, USCRN-modeled reference systems such as GOATS provide a practical, low-cost means of validating official records through direct, parallel measurement. Incorporating such validation into oversight, auditing, and review processes would materially strengthen the evidentiary foundation underlying climate-related policy decisions.
Frequently Asked Questions (FAQ)
What does GOATS stand for?
Global Open Atmospheric Temperature System.
Is GOATS measuring the same weather as the airport station?
Yes. The stations are close enough geographically to experience the same regional weather patterns. Differences arise from local surroundings, not regional climate.
Why compare stations only a mile apart?
Keeping stations close controls for weather differences. This isolates the effect of station placement.
Why are nighttime temperatures more important than daytime highs?
Nighttime lows are especially sensitive to heat stored in pavement and buildings. A larger nighttime difference is a classic indicator of localized heat bias caused by Urban Heat Island (UHI) effects.
Does this prove climate change is false?
No. It shows that measurement location and UHI exposure can materially affect temperature records and must be accounted for before drawing conclusions from long-term trends.
Are airport stations uniquely affected?
Airports often contain extensive pavement, heat-producing infrastructure, and the exhaust from aircraft themselves, making careful siting especially important to avoid UHI bias. Having said this, no, airports are not the only locations which demonstrate UHI bias, although they are often extreme cases. Stations have been found to be located on asphalt parking lots and rooftops, near air conditioning and heater exhausts, near hot springs, within feet of brick buildings, near barbecue pits, and at other locations where measurements are compromised.
Is this consistent with mainstream research?
Yes. Peer-reviewed studies, including work from Oak Ridge National Laboratory, report similar impacts from small-scale urban encroachment near temperature stations. See Ronald D. Leeper et al., “Impacts of Small-Scale Urban Encroachment on Air Temperature Observations,” Journal of the American Meteorological Society, Volume 58, Issue 6, June 1, 2019, https://journals.ametsoc.org/doi/10.1175/JAMC-D-19-0002.1
Why does this matter for policy?
Because surface temperature data inform energy, infrastructure, and environmental policy. Measurement bias propagates directly into policy decisions.
Where can the data be reviewed?
All GOATS data are publicly available at https://glcrn.net/view_device/7
Appendix: Acronyms and Terms
ASOS – Automated Surface Observing System. The official automated weather observing network used at U.S. airports.
FAA – Federal Aviation Administration.
GOATS – Global Open Atmospheric Temperature System. An independent, USCRN-modeled temperature measurement system created by Anthony Watts of the Heartland Institute.
Microsite Exposure: The surface conditions near the measuring temperature station. NOAA standards indicate that there should be no biasing heat retaining or generating elements within a 100 feet radius of a weather station.
NOAA – National Oceanic and Atmospheric Administration.
NWS – National Weather Service, a division of NOAA.
Tmax – Daily maximum (highest) air temperature, typically occurring mid-day.
Tmin – Daily minimum (lowest) air temperature, typically occurring overnight.
Tavg – Daily average temperature, calculated as (Tmax + Tmin) ÷ 2.
UHI – Urban Heat Island. Localized warming caused by heat absorption from sunlight during the day and release from artificial surfaces such as pavement, buildings, and equipment, especially at night.
USCRN – United States Climate Reference Network. NOAA’s highest-standard surface temperature network designed to minimize bias from station siting and environmental changes.

Anthony Watts is a senior fellow for environment and climate at The Heartland Institute.